CasaHunter — How I built a tool that apartment-hunts for you
1,000+
listings processed daily. 73 scored HIGH (75+/100), 322 MEDIUM (50-74), 524 LOW.
€0.25
AI + infrastructure cost per user per month. 95% gross margin.
How it started
I needed to find an apartment in Modena. Like everyone else in Italy, I was checking Immobiliare.it, Idealista, Subito, and agency websites separately. Each platform isolated, no way to see the full picture. The good apartments disappeared in hours. The algorithms didn't understand quality; they just sorted by recency or price.
So I built a scraper over a weekend. Parse every platform, score listings on actual quality: value-for-money, not keywords or popularity. Price against zone averages. Condition from photos. Commute time. Everything a human would check, but automated.
I ran it for weeks. The dashboard showed 1,029 listings across Emilia-Romagna, colored by score. Most were noise. But the high-scoring ones? They were genuinely good apartments. And I found mine using it.
The first version
The v1 dashboard was simple: a map with colored pins (green = high quality, yellow = medium, red = low), and a list view showing price, rooms, and AI score. No auth, no monetization. Just the data and the logic.
Friends started asking for access. That was the signal. Not "this is cool," but "I need this." They were doing exactly what I did — checking eight platforms manually, frustrated by the noise.
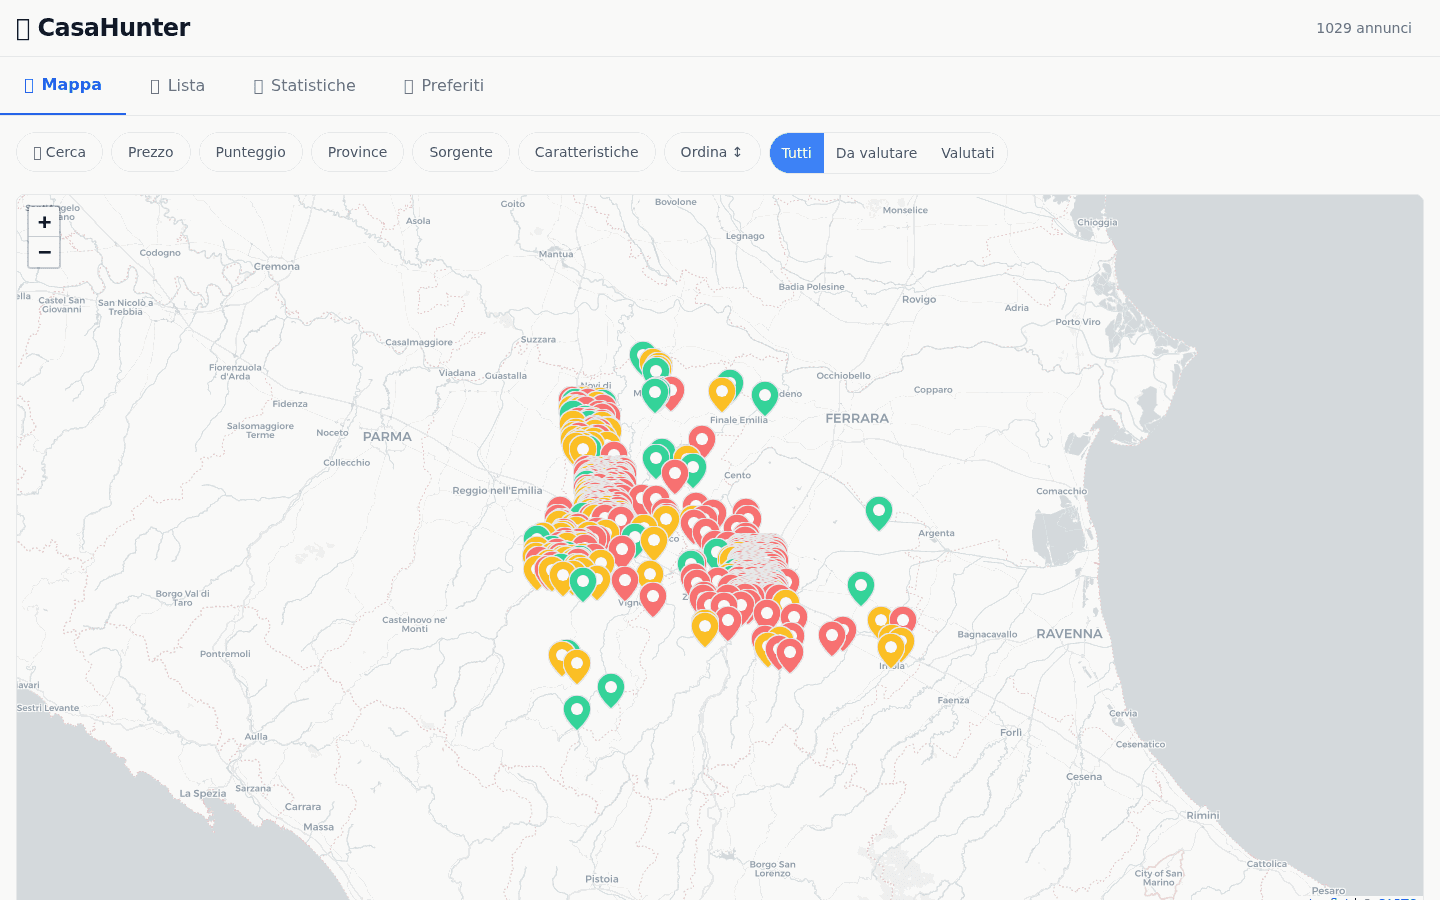
Map view — score-colored pins (green = high, yellow = medium, red = low)
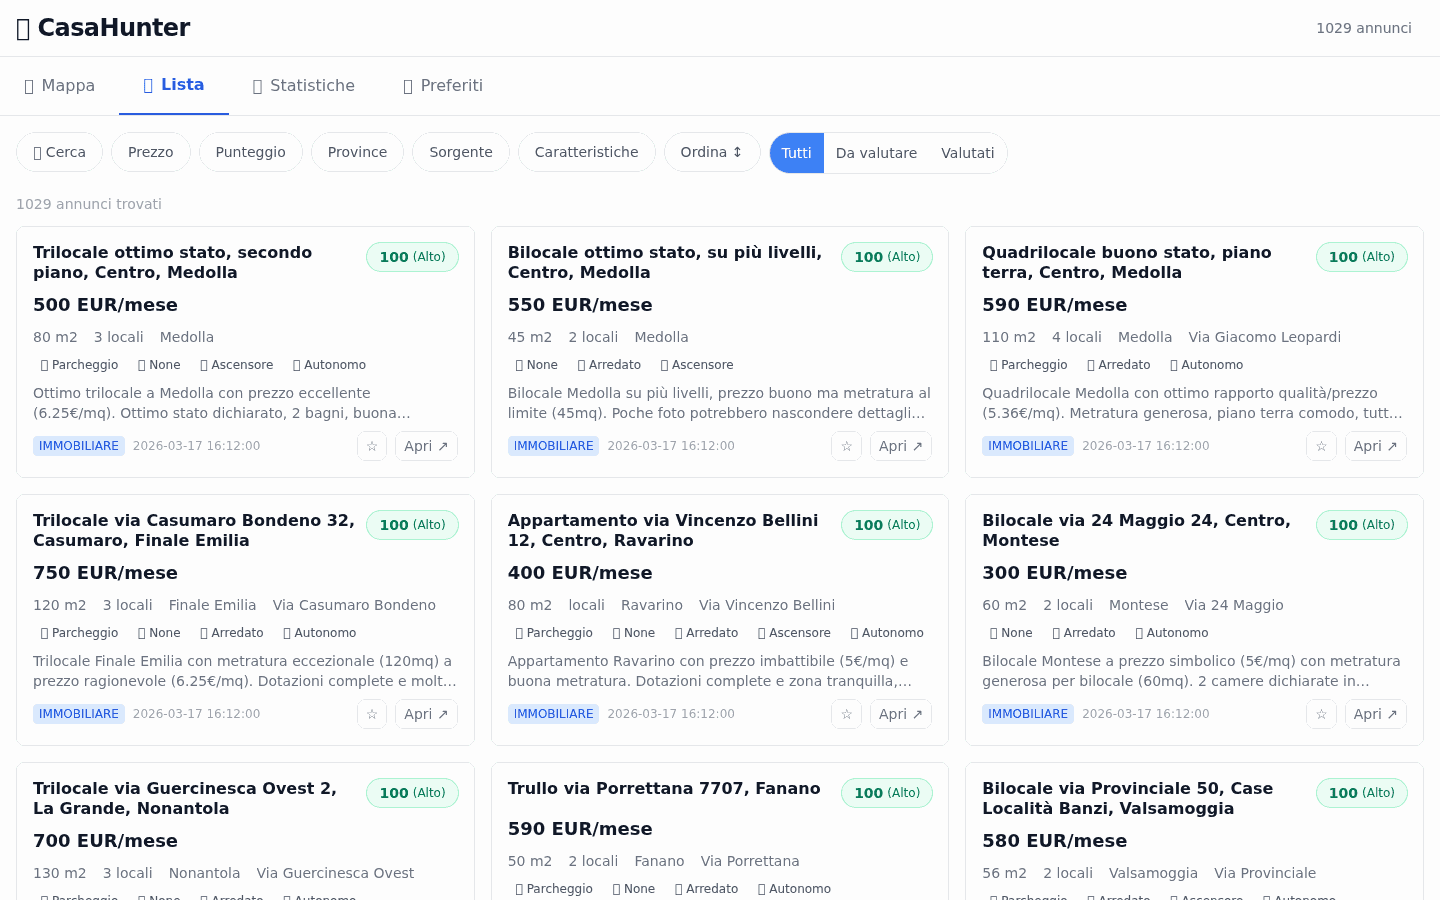
List view — cards with AI score, price, size and analysis
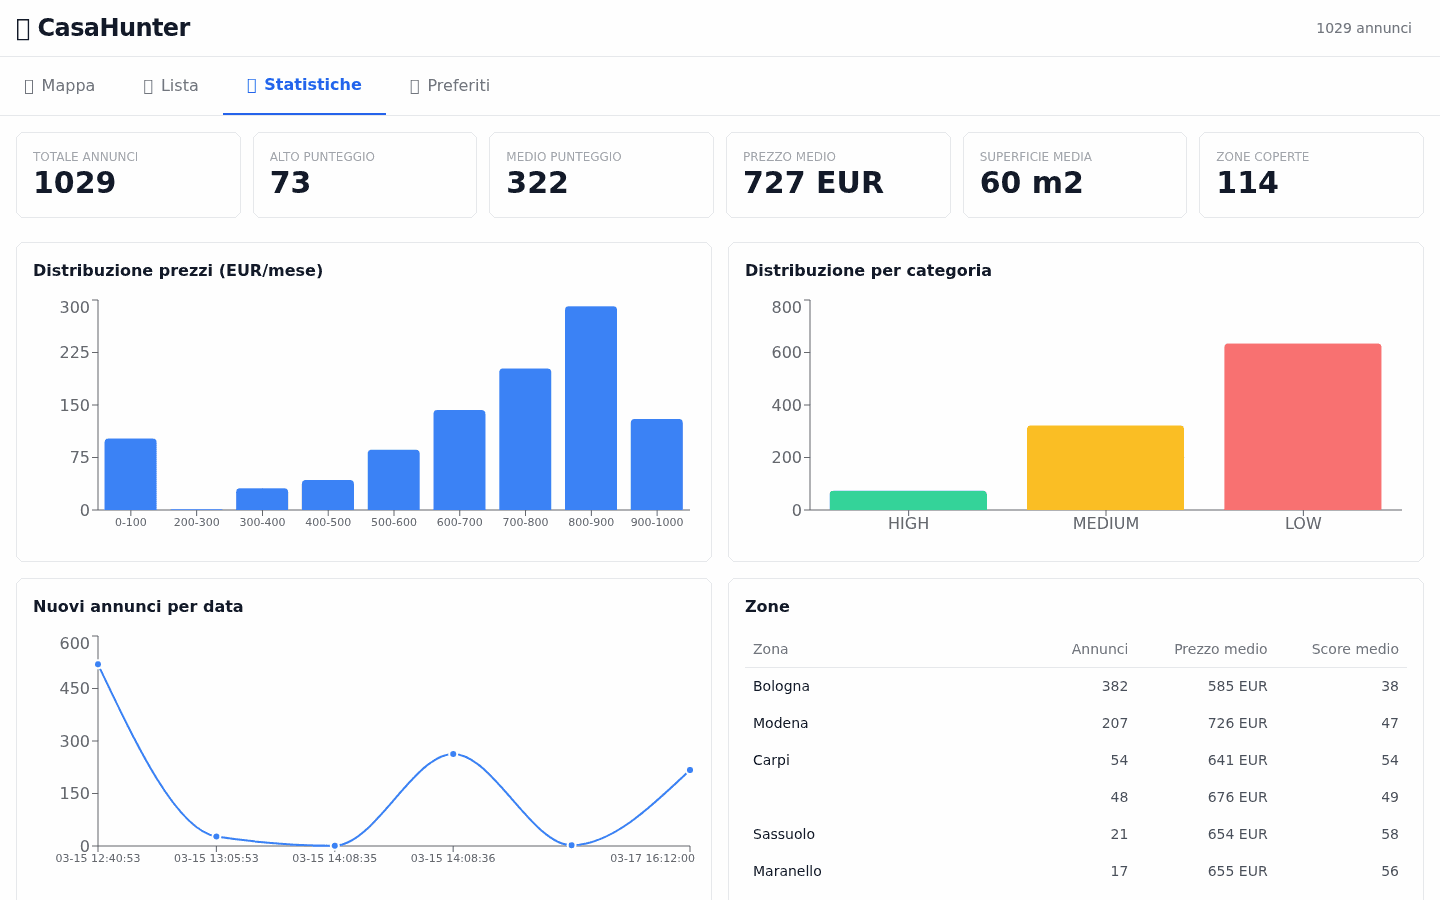
Statistics — price distribution, score categories, zone analysis
From tool to product
The turning point was realizing what didn't exist in the market: nobody does AI-based quality scoring. Aggregators exist. Alerts exist. But aggregators + scoring + "is this apartment for me?" That combination is a product gap.
That gap required a cost model. Running Claude Sonnet on all 1,000+ daily listings would be thousands monthly. Unsustainable. The answer: be ruthless about what deserves AI attention. Filter deterministically first (price, location, size — hard constraints), then spend AI budget on the 50% that passes the gate.
With that math solved, I decided to build a real product. Not just a bot, but a SaaS: Telegram for real-time alerts, dashboard for analysis, customer-grade infrastructure.
Three-pass scoring
Pass 1: Deterministic filter. Price, location, size, rooms. The system processes 1,029 listings per day. This pass eliminates ~51% without touching AI budget. Runs hourly, negligible cost.
Pass 2: AI scoring. Only the remaining 49% get Claude Sonnet. Real data from March 17: 73 HIGH (75+/100), 322 MEDIUM (50-74), 111 LOW. The AI reads text, analyzes photos, checks neighborhoods, compares zone prices.
Pass 3: Feedback loop. User feedback on Telegram refines scoring. Separate /outreach command auto-generates contact messages. The system learns what you actually want.
This structure keeps costs at ~€0.25/user/month. Without it, an order of magnitude higher.
8 Scrapers
collectImmobiliare, Idealista, Subito, Casa.it + 4 more
Dedup & Normalize
cleanRemove duplicates, standardize fields, geocode
Pass 1: Hard Filter
80% filteredLocation, price, size — binary yes/no
Pass 2: AI Scoring
weightedTransport, light, floor, noise — 0-100
Pass 3: AI Analysis
deep reviewRed/green flags from listing text
Final Score
0–100Composite weighted score
Telegram
alertInstant notification if score > threshold
The SaaS prototype
Built a Figma Make prototype to test the product vision: real-time Telegram bot alerts, persistent dashboard, saved searches, comparison tools. Not yet monetized — running on a waitlist to measure demand first.
The economics work (95% margin at €5–10/user/month), but the question remains: is demand strong enough to justify building the full SaaS? Friends asking for access is signal. Customer acquisition cost and churn are a different measurement.
Full SaaS design: landing page, dashboard, onboarding flow, pricing.
Open the prototypeWhat the numbers say
1,000+
listings processed daily across 8 Italian platforms
73
HIGH-scored listings per day (7% signal-to-noise ratio)
€0.25
AI + infra cost per user per month. 95% gross margin at scale.
Friends asking
The earliest signal. More meaningful than metrics.
Key decisions
Three-pass scoring, not full-AI
Every listing could go through GPT. It would be simpler to build and easier to explain. I chose a three-pass system instead: deterministic filters first (free), AI scoring second (only on what survived), feedback loop third (learning from user reactions). Half the listings get eliminated before AI sees them. Full-AI processing at 1,000+ listings/day would blow through any reasonable budget. And most listings fail on objective criteria — wrong zone, no elevator, too expensive. You don't need a language model to check a number.
WHAT IT TAUGHT METhe best use of AI in a product is the narrowest one. Throw AI at everything and you get a slow, expensive system that's hard to debug. Constrain where it runs and it becomes the part that actually matters.
Telegram first, not a web app
The obvious move was a dashboard. Search filters, map view, saved listings. I built one as a prototype. Then I shipped on Telegram instead. The target user — someone apartment hunting in Italy — checks their phone between viewings, on the bus, during lunch. A Telegram bot delivers a scored listing in a push notification. No login, no tab to remember, no app to install. The interaction is: notification arrives, glance at score, tap to open listing. Five seconds.
WHAT IT TAUGHT METhe right interface isn't the most capable one. It's the one that fits the moment when the user needs it. A dashboard is a better product on paper. A bot is a better product in someone's pocket.
Fixed AI budget per user: €0.25/month
Before writing any architecture, I set a constraint: the AI cost per active user cannot exceed €0.25/month. Every technical decision flowed from this number. Without a cost ceiling, AI features expand until the product is unprofitable or the pricing is absurd. €0.25 meant 95% gross margin at a €10/month price point. It also meant I had to be ruthless about what deserved AI attention and what didn't — which made the three-pass architecture inevitable.
WHAT IT TAUGHT MEA budget constraint isn't a limitation. It's a product decision that makes every other decision easier. "Can we add AI to X?" becomes "Does X fit within €0.25?" — and suddenly the answer is obvious.
What I learned
Building intelligence costs more than building aggregation. Every SaaS tool aggregates something; the moat is what you do with the data after. For apartments, that's AI scoring that answers "is this for me?"
Unit economics determine product strategy. At €0.25/user/month, break-even is ~150 users at €10/month. That shaped everything: the architecture, the feature set, the go-to-market.
Validate first, build later. The dashboard and bot work. The SaaS is not live. I'm measuring demand before committing to customer support infrastructure. That's the hard part. The code is the easy part.
Resources
Live dashboard: https://casahunter.vercel.app/ — the scoring, the listings, the market intelligence.
Telegram bot: Running 24/7 for testing. Processes daily alerts, handles /outreach command for message generation.